Printing and Plotting
In his CUPS-Help How-To, Kurt Pfeifle demonstrates his mastery of understatement: “Printing is one of the most complicated things in day to day IT usage.”
To a large extent, HiWIRE® isolates you from the details. Unless you want the utmost rendering fidelity, printing and plotting in HiWIRE® is quite simple.
Configuring Your Printer
In a commodity market characterized by razor-thin margins, printer manufacturers compete by introducing a series of largely cosmetic changes and incompatible, whiz-bang features that smother any attempt at standardization.
HiWIRE generates a PostScript® page description, and relies on the Ghostscript interpreter to rasterize the description – convert it into an array of colored dots so it can be rendered by a laser or inkjet printer.
On Linux and Mac, HiWIRE uses the Ghostscript interpreter supplied with the system. On Windows, HiWIRE provides its own version.
Windows
By default on Windows, HiWIRE instructs Ghostscript to use Windows’ GDI, to shield you from the details of printer operation. In this mode, Ghostscript mostly translates PostScript commands into their GDI equivalents and relies on the operating system and the printer manufacturer's driver to do the rasterization.
As a result, there is nothing special you must do to configure your printer for HiWIRE. Just follow the instructions provided by the printer manufacturer for installation on your particular version of Windows. If you can print from Microsoft Word®, you should be able to print from HiWIRE.
When instructed to use the GDI, Ghostscript displays the standard Windows print dialog and allows you to select a specific printer, feed tray, paper size, etc.
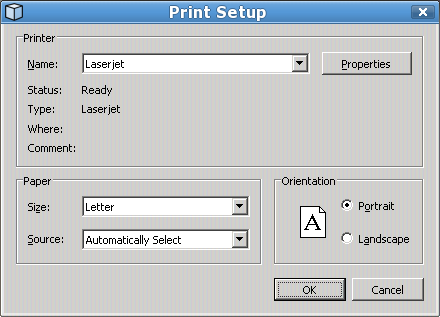 |
Figure 12A |
The appearance of this dialog may vary slightly depending on your network, user-interface settings, etc., but you should be quite familiar with it. It is nearly universal amongst Windows programs that can print.
Linux and Mac
Both these environments use the Common Unix Printing System to handle printing.
CUPS includes Ghostscript, but augments it with various network protocols, spooling facilites, PPD printer feature selection, browser-based setup and job control, etc. Although it is extremely versatile, it can be somewhat difficult to configure.
HiWIRE assumes you have CUPS setup and working on your system.
When using CUPS, HiWIRE makes very conservative assumptions about what paper is loaded in your printer. Depending on your requirements, it can break up your drawing into pieces and render it on a series of letter-sized sheets. The images on these sheets overlap slightly so you can reassemble them into the larger image of your drawing.
Under CUPS, HiWIRE uses an imagable area small enough to fit on either 8.5x11in (A-sized) or the equally-common metric A4. To minimize waste, power users are encouraged to edit the Python configuration file, UPS.py, guided by comments therein.
Printing
To print your drawing:
In Edit->Preferences…, set Text Size: to the size of the smallest label you want to see. Smaller labels will not be printed.
Lasso or otherwise select the subset of items you want to print, or select nothing if you want to print everything in your drawing.
Select Script->Print Selection from the menu.
Into the dialog (shown below), enter:
The layers to print and the corresponding colors to use,
The scale factor to be applied to the printout.
The name of a file to hold the printer data. Or, leave blank to send data directly to the printer.
Click Print (or press Enter) to proceed, or click Cancel if you change your mind.
The print dialog has three text-entry fields:
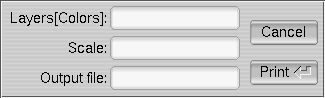 |
Figure 12B |
Specifying Layers
Into the Layers(Colors): field, enter a comma-separated list of layers you want to print. To each layer, you can append a one-letter color suffix: K, W, R, G, B, C, M, or Y for blacK, White, Red, Green, Blue, Cyan, Magenta or Yellow, respectively. If no suffix is used, K is assumed. Layers that appear later in the list will be displayed on top of layers that appear earlier.
For example, 255G,1R,0 will first paint layer-255 objects in green. It will next paint layer-1 objects in red, overpainting any layer-255 objects where they overlap. Finally, it will paint layer-0 objects in (the default) black, perhaps obscuring things it earlier painted in red or green.
On monochrome printers, color-suffixed layers will render in varying shades of grey.
If you use round, layer-253 pads for holes, you can plot holed pads (useful for hand-drilled prototypes). E.g., plot the solder-side artwork using Layers(Colors): 1, 0, 253w to plot the solder-side traces and all-layer, solid pads in black, and afterward erase holes in the pads.
Specifying Scale
Into the Scale: field, either:
Enter a scale factor. For example, 1.0 or 0.5 will render at full- or half-scale, respectively.
Enter a width and height along with a units suffix (in or mm). For example 16x20in will rotate and scale your drawing to fit within this rectangle and render it using as many sheets as necessary.
Leave the field blank to scale the output to fit a single sheet of paper.
Specifying a Destination
For the Output file: field, either:
Leave the field blank to send the output directly to the printer.
Enter a file name with a suffix of .pdf to generate a PDF file, viewable by Adobe Acrobat® or equivalent.
Enter a file name with a suffix of .eps to generate an Encapsulated PostScript file, intended for importation into a word processor or desktop publishing program.
Enter a file name with neither suffix to generate a generic PostScript file. This option assumes a conservative media size, and if necessary, will break the output into multiple pages as required by Scale:.
Filenames may be absolute (e.g., C:\TMP\foo.pdf under Windows or /tmp/foo.pdf under Linux and Mac) or relative (e.g., just foo.pdf). In the latter case, files are saved into the current directory.
In a GUI, the location of the current directory depends on your operating system and its settings. You may have to search for the resulting file using your file manager (e.g., Windows Explorer).
HiWIRE printing is implemented as a Python script, render.py. You can edit the source code of this script to affect a number of simple changes. Or, if you're the adventuresome sort, you can delve deeply into the operation of the script and completely customize it to better suit your needs.
Be sure to save a copy of the original script so that you can back out if your changes don't work the way you intended.
Photoplotting
To photoplot part of your drawing, select the items you want to photoplot and select Script->Photoplot Selection from the menu. If nothing is selected, HiWIRE will photoplot the entire drawing.
HiWIRE will render your layout into a series of files: Gerb.001, Gerb.002, etc. It also generates a text file, GerbRead.Me, that describes the contents of these files. The files are written to the current directory. Send the Gerb.nnn files along with GerbRead.Me to your supplier who will use them to fabricate your circuit board.
You must use the layering conventions described in Circuit Boards. HiWIRE's photoplotting script, gerber.py, examines your board and watches for certain objects on key layers to infer the presence of power-planes, drilled holes, etc.
You have the source code to this script. You can customize it to support a different layering convention if your manufacturing process requires it.
Comments in the script describe its rules for determining which layers to plot; refer to these comments for details. In particular, the script infers the number of signal layers from the first unoccupied layer: A two-layer design must have nothing on layer 3. A six-layer design (with four signal layers and two power planes) must keep layer 5 empty.